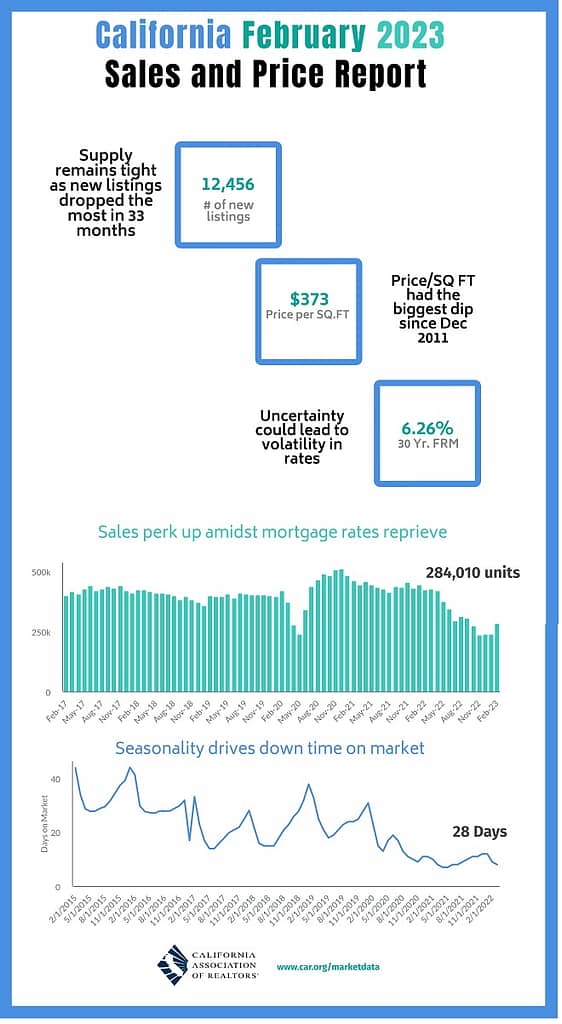
Source: car.org


Lemoyne, PA – Jan. 20, 2023 (PRNewswire) The Pennsylvania housing market saw a shift in activity in December, according to a report prepared for the Pennsylvania Association of Realtors®. The median existing home sales price of homes sold dropped 11% from the previous month to $193,792 in December, which is nearly the same as it was a year ago.
“Looking at our year-end totals, the median sales price overall for 2022 was $208,185,” said PAR President Al Perry. “That’s about 8% higher than the median price for 2021 and 21% higher than 2020. Like most of the country, I think Pennsylvania is starting to see prices leveling off. Most experts have been predicting a more modest 2% to 3% increase in prices overall this year, which is a shift from the more aggressive price increases that we’ve been experiencing the past few years.”
Home sales fell slightly to 9,176 in December, down from 9,663 in November. As a result of the low inventory, sales were down 33% compared to the same time the previous year.
The number of listings dropped to the lowest number all year in December to 28,801.
“Listings are down 20% from the same time last year,” Perry added. “Overall, we’ve seen the average number of listings decline about 10,000 each year since 2020. The industry has underbuilt homes for more than a decade and as more millennials look to become homeowners, we’re seeing a lack of available homes that they can afford. That shortage of homes continues to keep prices up overall.”
“With interest rates between 6% and 7%, many buyers are more cautious about entering the market,” he said. “Working with a Realtor® can help them navigate the market to determine how to best meet their housing needs.”
The Pennsylvania Association of Realtors® is a trade/professional association that serves more than 39,000 members in the commonwealth of Pennsylvania.
SOURCE Pennsylvania Association of Realtors

Washington, D.C. – Oct. 21, 2022 (PRNewswire) The Nation’s longest home price boom has ended after a run-up lasting 10½ years. Since prices peaked in June, we have had Month-on-Month declines of 0.5%, 0.4%, & 0.2% in September, August, & July respectively, according to data from the American Enterprise Institute’s Housing Center.
Out of the 60 largest metros, 51 have had a decline from their respective peak home price levels, and only 2 are still growing. San Jose, San Francisco, & Seattle had the biggest declines from their peaks at -10.7%, -8.5%, and -8.2% respectively (see #1 in graphic).

September’s Year-on-Year HPA was 10.3%, down from 11.6% a month ago, a YoY peak of 17.2% in March 2022 and 15.8% a year ago. Based on Optimal Blue rate lock data, YoY HPA is projected to decline to further 9.2% in October 2022 and 7.4% in November and YoY HPA is expected to slow to 4%-6% for December 2022.
YoY HPA varied significantly among the 60 largest metros. It ranged from 2.6% and 3.4% in San Francisco and San Jose to 21.2% and 20.6% in Cape Coral and North Port (see #2 in graphic).
Historically, HPA in the low price tier outpaced HPA in the upper price tiers. This trend continues to hold true. Although home prices were down across all four price tiers, the high end and low end of the market were hit differently. In September, high price tier was down 3.7% from its peak in May 2022, while low price tier was down 0.5% from its peak in July.
September months’ supply & active listings both increased above seasonal trends, but remain at historically low levels. Months’ supply stood at 1.9 months in September 2022, down from 2.8 months in September 2019, but up from 1.7 months in August 2022, and 0.7 months in April 2022 (see #3 in graphic).
Link to National Home Price Appreciation (HPA) Index – September 2022
Media Contact Details:
Arthur Gailes
American Enterprise Institute Housing Center
Washington, DC
aei.org/california-housing-conference
Arthur.gailes@aei.org
804-662-0874
SOURCE AMERICAN ENTERPRISE INSTITUTE FOR PUBLIC POLICY RESEARCH